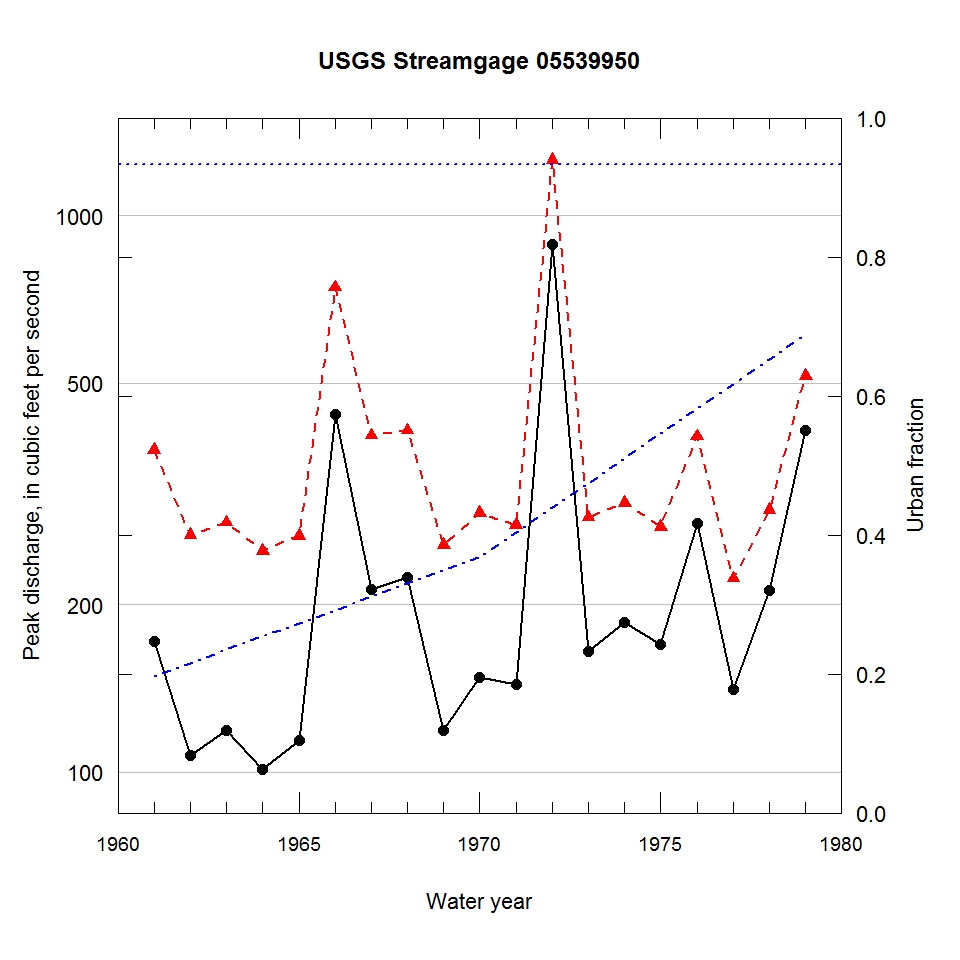
Observed and urbanization-adjusted annual maximum peak discharge and associated urban fraction and precipitation values at USGS streamgage:
05539950 KLEIN CREEK AT CAROL STREAM, IL


| Water year | Segment | Discharge code | Cumulative reservoir storage (acre-feet) | Urban fraction | Precipitation (inches) | Observed peak discharge (ft3/s) | Adjusted peak discharge (ft3/s) | Exceedance probability |
| 1961 | 1 | -- | 0 | 0.197 | 1.410 | 172 | 379 | 0.393 |
| 1962 | 1 | -- | 0 | 0.216 | 0.623 | 107 | 267 | 0.735 |
| 1963 | 1 | -- | 0 | 0.235 | 1.362 | 119 | 281 | 0.689 |
| 1964 | 1 | -- | 0 | 0.254 | 2.156 | 101 | 250 | 0.785 |
| 1965 | 1 | -- | 0 | 0.273 | 0.791 | 114 | 266 | 0.740 |
| 1966 | 1 | -- | 0 | 0.292 | 1.488 | 440 | 744 | 0.038 |
| 1967 | 1 | -- | 0 | 0.311 | 1.311 | 213 | 403 | 0.326 |
| 1968 | 1 | -- | 0 | 0.330 | 1.984 | 224 | 411 | 0.303 |
| 1969 | 1 | -- | 0 | 0.349 | 1.350 | 119 | 256 | 0.768 |
| 1970 | 1 | -- | 0 | 0.368 | 1.373 | 148 | 292 | 0.653 |
| 1971 | 1 | -- | 0 | 0.404 | 0.335 | 144 | 278 | 0.702 |
| 1972 | 1 | -- | 0 | 0.439 | 2.106 | 888 | 1260 | 0.007 |
| 1973 | 1 | -- | 0 | 0.475 | 0.819 | 165 | 287 | 0.668 |
| 1974 | 1 | -- | 0 | 0.510 | 0.584 | 186 | 305 | 0.610 |
| 1975 | 1 | -- | 0 | 0.546 | 1.071 | 170 | 276 | 0.709 |
| 1976 | 1 | -- | 0 | 0.582 | 1.124 | 280 | 401 | 0.327 |
| 1977 | 1 | -- | 0 | 0.617 | 0.644 | 141 | 223 | 0.857 |
| 1978 | 1 | -- | 0 | 0.653 | 0.835 | 212 | 296 | 0.639 |
| 1979 | 1 | -- | 0 | 0.688 | 0.989 | 412 | 516 | 0.148 |

